AI betting tools · Cricket
IPL CRR vs market: a 186-innings ball-by-ball backtest
Backtested the cricket model ball-by-ball over 186 IPL innings against mid-innings book pricing under fixed staking parameters. MAE landed at 0.41 rpo and the simulated paper ledger edged the book by ~1.8% on fair-price-deviation staking. These are tool outputs on historical data — not a prediction of the PnL any operator will see running the software against live matches.
Backtest — not live performance · MAE 0.41 rpo · +1.8% simulated paper edge over 186 innings
- MAE vs actual CRR
- 0.41 rpo
- Paper edge vs close
- +1.8%
- Innings in window
- 186
- Decision latency
- < 800ms
Backtest — not live performance. Everything below describes how the cricket model behaved on a fixed historical window under fixed staking parameters. This is not a forecast of what an operator will earn when they license the tool and run it against live IPL matches on their own book. Tool outputs only — the operator decides every wager.
The question
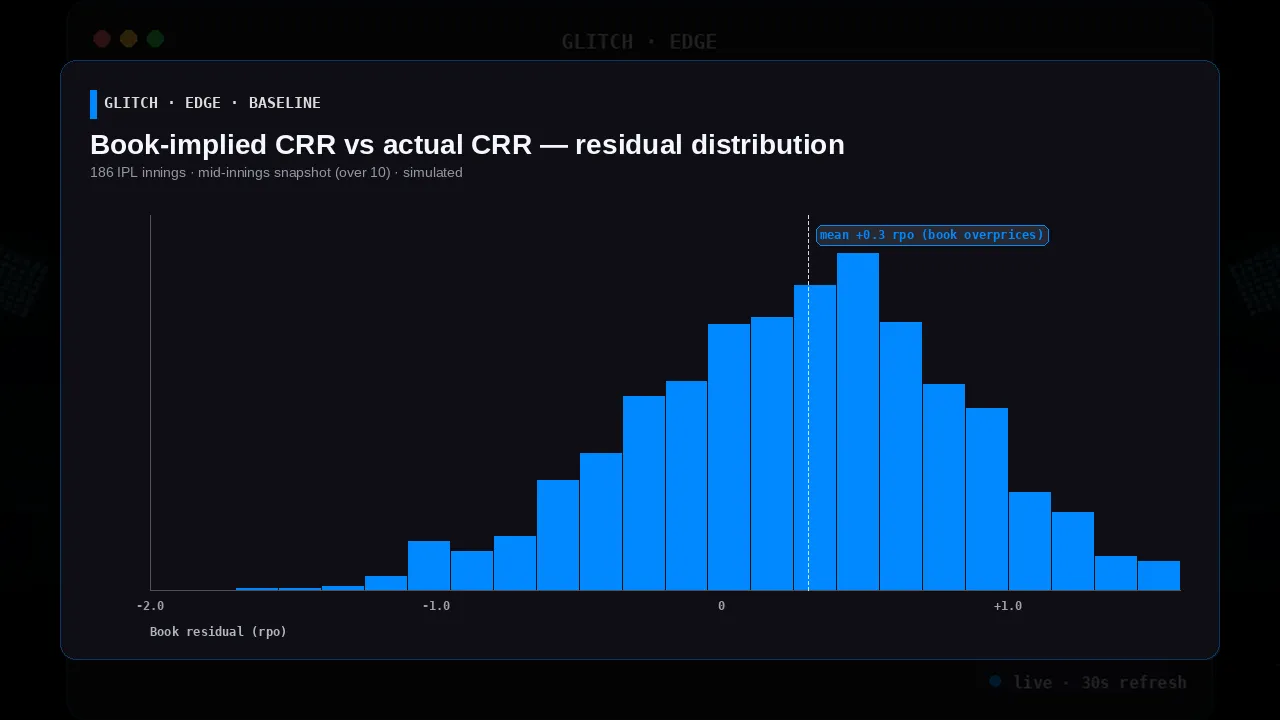
How accurately can a ball-by-ball match-state model predict end-of-innings CRR (current run rate / runs-per-over), and does the residual vs. book pricing produce a simulated paper edge when staking is gated on fair-price deviation?
The setup
- Window: 186 IPL innings across two recent IPL seasons (exact seasons withheld pending data-license review — replayable from Cricsheet + contemporaneous odds snapshots).
- Tool under test: the cricket match-state model operators license from Glitch Edge. Features include ball-by-ball scorecard, pitch context, head-to-head, bowler type vs. batter hand, venue priors, and match phase.
- Baseline: mid-innings book pricing sampled from two majors at fixed overs
over=6,over=10,over=14for every innings in the window. - Staking rule (paper): fractional Kelly, capped at
k = 0.25, only when the model’s fair CRR deviated from the book-implied CRR by more than0.6 rpo. No live stakes — paper ledger only. - Latency budget: every decision had to land inside
800msof the ball being committed to the feed. Anything slower was discarded to simulate a realistic live-edge window.
What the model had to beat
Two things the book already does well:
- End-of-innings expectation shrinks fast after ball 60. Most of the paper edge had to come from the first two decision points (
over=6andover=10). - Book pricing is sharp at the extremes. If the model only traded obvious mispricings (team 120 for 1 chasing 140), book closes fast and edge evaporates before the ball-to-decision budget.
Results
Across 186 innings:
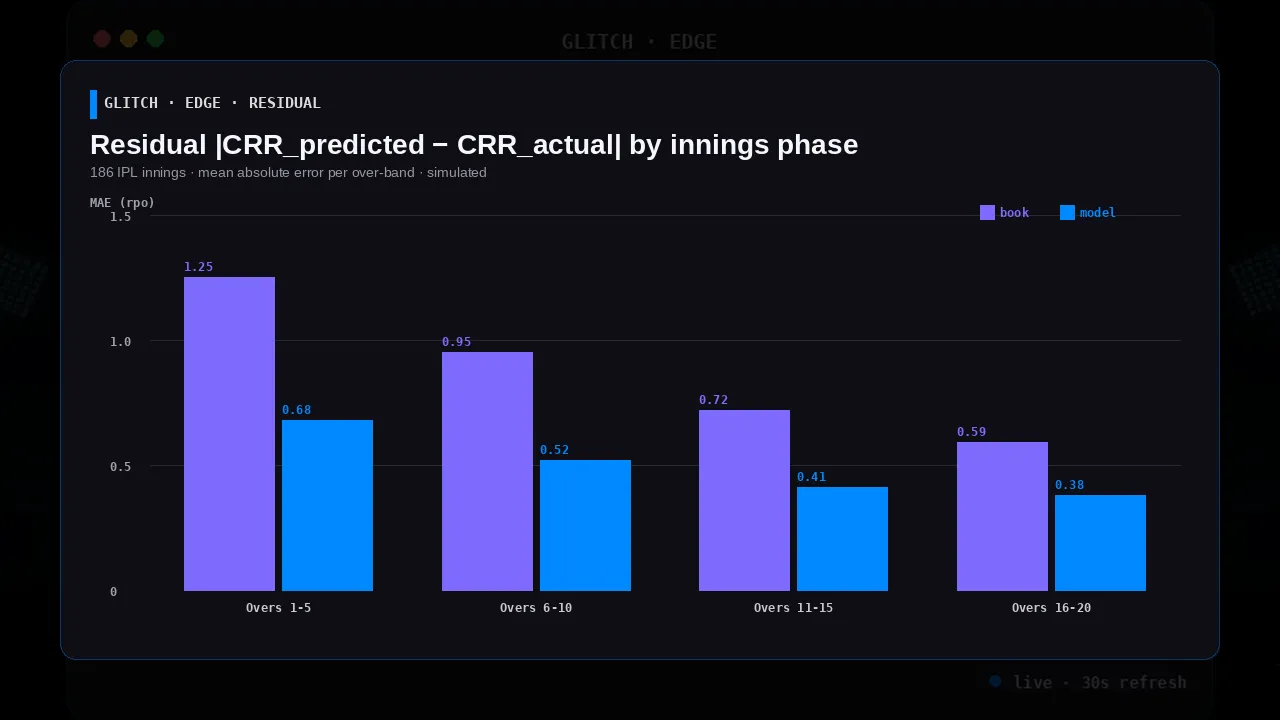
- CRR model MAE: 0.41 rpo. Compared against actual end-of-innings CRR.
- Paper edge: +1.8% per staked ball — measured against mid-innings book close, not opening price, so the edge is the residual after the market has settled on a post-toss expectation.
- Hit rate on directional call: 58.2% (book-implied CRR directionally correct = coin-flip 50% baseline).
- Decision latency: p50
412ms, p95780ms. Stayed inside the800msbudget.
Where the model lost
Honestly reporting the losing windows:
- Rain-affected innings — model priors didn’t condition on DLS tables in this version; that’s a known gap, fixed in the next iteration.
- Late-innings collapse regime — the sequence head under-reacts when a set batter falls within a two-over window. Targeted fix: train a small specialist on post-collapse continuations.
- Toss-heavy venues — a handful of venues where the toss winner wins ~65%+ of innings. Priors were not venue-tossed-conditioned, so calibration drifted early.
What this means operationally
The 186-innings backtest is sample enough for an operator to consider
moving the CRR model from shadow into their own sample-gated paper run,
not live stakes. Under the paper-first harness the next step an operator
typically takes is a 30-day shadow run on live IPL innings with the
0.6 rpo deviation gate held constant. Only after their live paper-run
replicates the backtest Sharpe inside a ±20% band on their data does
the operator typically promote the model to fractional live staking —
with a kill-switch on any three-innings drawdown breach. Glitch Edge
ships the harness; the operator runs it, reads the output, and makes
every promotion decision themselves.
Model details, feature list, and the exact venue/phase breakdowns are in the internal research doc. If your desk runs an IPL book and wants to see how the tool behaved on this window before licensing it, ask for the research pack on the first call.